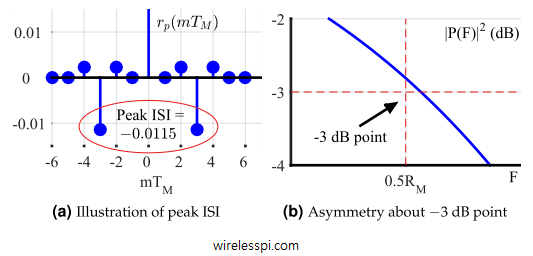
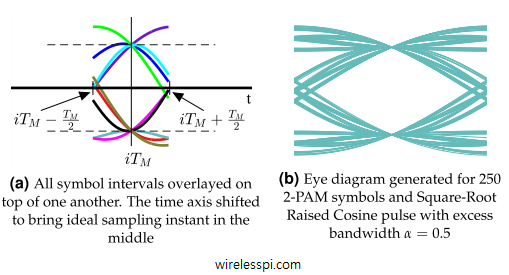
In this article, we will devise some tools that help us diagnose problems with the communication system under study. I like to call them the stethoscopes for a communication system due to the crucial functionality they provide regarding the health of the communication system being analyzed. We discuss three such tools, namely an eye diagram, a transition diagram and a scatter plot below. Eye Diagram An eye diagram is an excellent summary of the signal behaviour in time domain, something analogous to a spectrum in frequency domain. Imagine the samples of the matched filter output taken at a much higher
Continue readingTag: Inter-Symbol Interference (ISI)
Pulse Shaping Filter
In digital logic, a stream of 1s and 0s forms a sequence of rectangular pulses, which can be easily identified at the receiver side by a threshold. In time domain, everything looks nice and perfect. Let us investigate the system characteristics in frequency domain. In a Pulse Amplitude Modulation (PAM) system, the main component that defines the spectral contents of the signal is the pulse shape $p(nT_S)$ at the Tx. We start with our attention towards a simple rectangular pulse shape. Here is a brief outline of what we cover in this article. Table of Contents 1. Spectrum of a
Continue reading