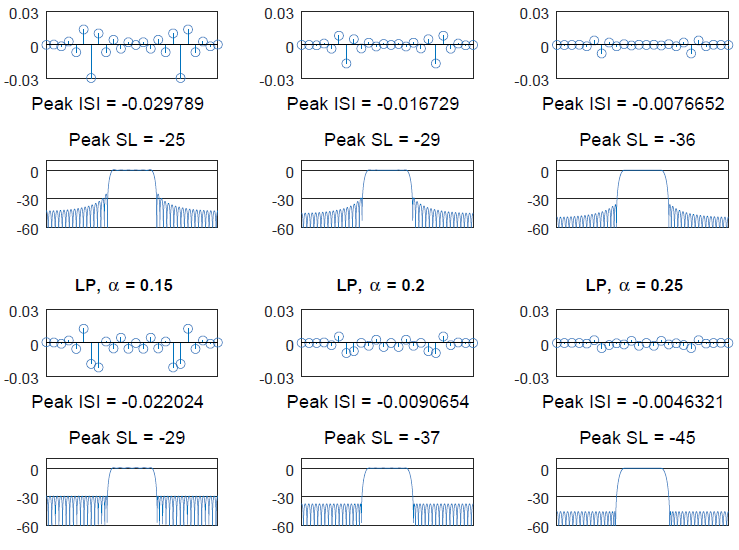
Square-root Nyquist filters for three different excess bandwidths

How to Design Nyquist and Square-Root Nyquist Pulse Shaping Filters

The radio spectrum is a very precious resource like real estate and must be utilized judiciously. Pulse shaping filters control the spectral leakage of the transmitted signal in a wireless channel due to the strict restrictions to comply with a spectral mask. This is even more important for the upcoming 5G wireless systems which are based on a variety of wireless transmission protocols (such as mobile networks, Internet of Things (IoT) and machine to machine communications) combined in one comprehensive standard. Even for wired channels, there is always a natural bandwidth of the medium (copper wire, coaxial cable, optical fiber)

Continue reading
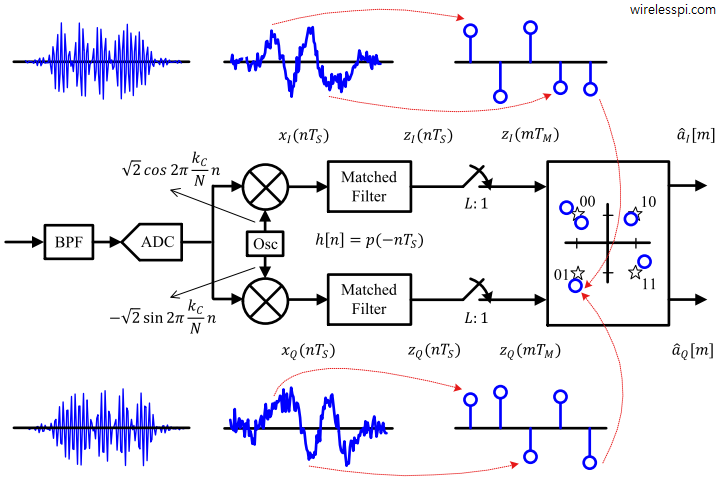
A general QAM detector with respective waveforms at each block

Quadrature Amplitude Modulation (QAM)

Quadrature Amplitude Modulation (QAM) is a spectrally efficient modulation scheme used in most of the high-speed wireless networks today. We discussed earlier that Pulse Amplitude Modulation (PAM) transmits information through amplitude scaling of the pulse $p(nT_S)$ according to the symbol value. To understand QAM, two routes need to be traversed. Route 1 We start the first route with differentiating between baseband and passband signals. A baseband signal has a spectral magnitude that is nonzero only for frequencies around origin ($F=0$) and negligible elsewhere. An example spectral plot for a PAM waveform is shown below for 500 2-PAM symbols shaped by

Continue reading
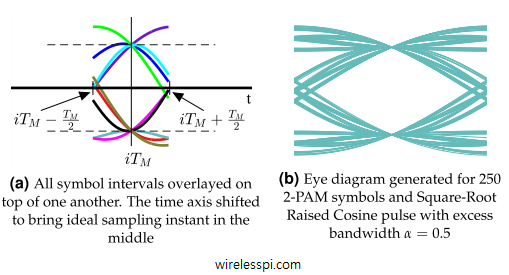
All symbol intervals are overlayed on top of one another and the time axis is shifted to bring ideal sampling instant in the middle. Eye diagram generated for 250 2-PAM symbols and Square-Root Raised Cosine pulse with excess bandwidth 0.5

Tools for Signal Diagnosis

In this article, we will devise some tools that help us diagnose problems with the communication system under study. I like to call them the stethoscopes for a communication system due to the crucial functionality they provide regarding the health of the communication system being analyzed. We discuss three such tools, namely an eye diagram, a transition diagram and a scatter plot below. Eye Diagram An eye diagram is an excellent summary of the signal behaviour in time domain, something analogous to a spectrum in frequency domain. Imagine the samples of the matched filter output taken at a much higher

Continue reading
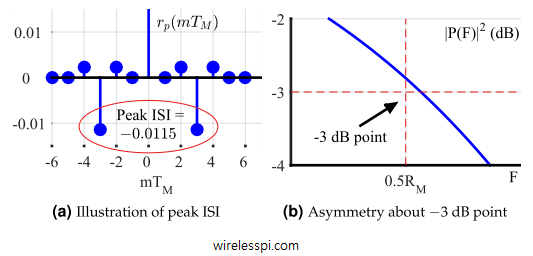
Illustration of peak ISI and asymmetry about -3dB point

Pulse Shaping Filter

In digital logic, a stream of 1s and 0s forms a sequence of rectangular pulses, which can be easily identified at the receiver side by a threshold. In time domain, everything looks nice and perfect. Let us investigate the system characteristics in frequency domain. In a Pulse Amplitude Modulation (PAM) system, the main component that defines the spectral contents of the signal is the pulse shape $p(nT_S)$ at the Tx. We start with our attention towards a simple rectangular pulse shape. Here is a brief outline of what we cover in this article. Table of Contents 1. Spectrum of a

Continue reading