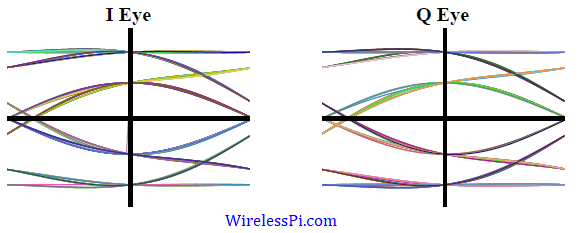
Eye diagram for a 4-QAM modulated signal and a simple channel impulse response

Impact of Multipath on the Received Signal

In this article, we describe the impact of multipath caused by the wireless channel on the signal arriving at the receiver from a constellation viewpoint. Recall that an eye diagram, a transition diagram and a scatter plot are the stethoscopes of a communication system and hence it is imperative to bring in that perspective for a Tx signal convolved with the channel impulse response. This is because a wireless channel can be seen as a Finite Impulse Response (FIR) filter with the result that the sampled Rx signal is a convolution between taps of this FIR filter and the Tx

Continue reading
Computing noise power within a specified bandwidth

Additive White Gaussian Noise (AWGN)

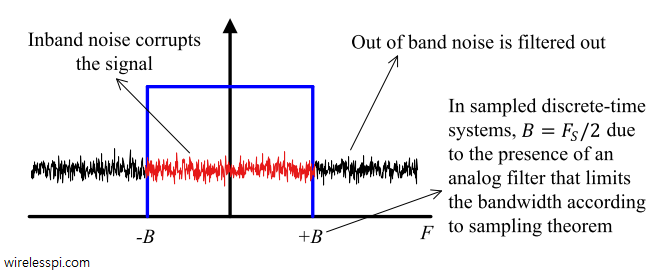
The performance of a digital communication system is quantified by the probability of bit detection errors in the presence of thermal noise. In the context of wireless communications, the main source of thermal noise is addition of random signals arising from the vibration of atoms in the receiver electronics. You can also watch the video below. The term additive white Gaussian noise (AWGN) originates due to the following reasons: [Additive] The noise is additive, i.e., the received signal is equal to the transmitted signal plus noise. This gives the most widely used equality in communication systems. \begin{equation}\label{eqIntroductionAWGNadditive} r(t) = s(t)

Continue reading
Wired and wireless channels

Modulation – From Numbers to Signals

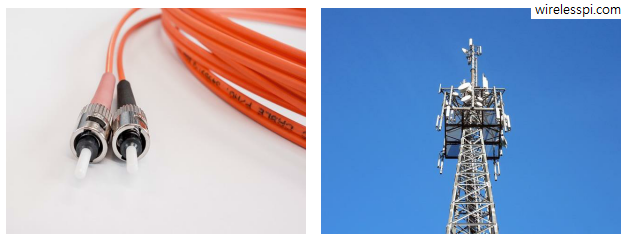
The purpose of digital communications is to send digital data across a channel which can be wireless telephone lines coaxial cable optical fiber Ethernet USB chips on a printed circuit board Considering the examples shown in Figure above, clearly neither a bit sequence nor a symbol sequence can be transmitted on their own through these channels — as they are nothing more than a set of numbers. Therefore, a signal waveform is an appropriate tool that can travel down the channel and carry the required information — just like a train running on its track and carrying the load. For

Continue reading
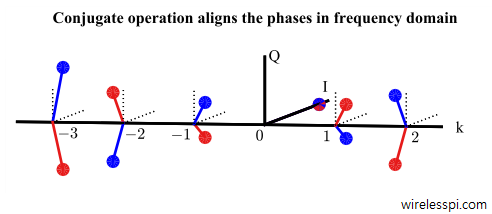
The blue line is the signal template and while red is the matched filter. Notice the same magnitude on each spectral line but exactly opposite phase

Demodulation – From Signals Back to Numbers

Remember that in the article on correlation, we discussed that correlation of a signal with proper normalization is maximum with itself and lesser for all other signals. Since the number of possible signals is limited in a digital communication system, we can use the correlation between incoming signal $r(nT_S)$ and possible choices $s_0(nT_S)$ and $s_1(nT_S)$ in a digital receiver. Consequently, a decision can be made in favor of the one with higher correlation. It turns out that the theory of maximum likelihood detection formalizes this conclusion that it is the optimum receiver in terms of minimizing the probability of error.

Continue reading