In this article, we describe the impact of multipath caused by the wireless channel on the signal arriving at the receiver from a constellation viewpoint. Recall that an eye diagram, a transition diagram and a scatter plot are the stethoscopes of a communication system and hence it is imperative to bring in that perspective for a Tx signal convolved with the channel impulse response. This is because a wireless channel can be seen as a Finite Impulse Response (FIR) filter with the result that the sampled Rx signal is a convolution between taps of this FIR filter and the Tx signal.
Eye Diagram
As an example, we take a really simple channel with just two multipath $N_{MP}=2$ with an amplitude of $1$ and $0.3$ and the second path arrives exactly at the start of the next symbol after the first, i.e.,
\begin{align*}
\rho_0 = 1, \quad & \tau_0 = 0 \\
\rho_1 = 0.3, \quad & \tau_1 = T_M
\end{align*}
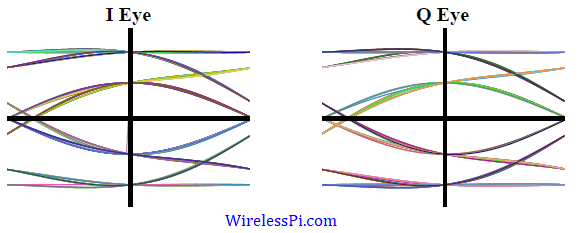
Now we draw the eye diagram of such a simple channel in the above figure for a $4$-QAM signal and zero noise. Observe that due to the two paths adding with one another, the eye diagram exhibits $4$ distinct levels for each $I$ and $Q$ waveform at the ideal sampling instants and hence the distortion significantly alters the eye pattern. Moreover, owing to the benignity of the channel, the eye is not close and the modulated signal can be recovered through any simple equalization technique.
Scatter Plot
The transition diagram or phase trajectory for the continuous-time signal arriving at the Rx after passing through the same channel is plotted on the top left in the figure below where the channel characteristics are not clearly visible. On the other hand, downsampling the signal to $L=32$ samples/symbol and $L=16$ samples/symbol and drawing the scatter plots on the top right and bottom left, respectively, reveals a certain kind of structure in the Rx signal. This structure arises due to the linearity of the channel resulting in an addition of the channel paths and is inherently different from what we observe for random noise.

Finally, a symbol rate scatter plot after downsampling the signal to $L=1$ sample/symbol is illustrated at the bottom right of the above figure which is analogous to the ideal sampling instants of the eye diagram shown before. Just like the eye diagram manifests $4$ distinct levels for each $I$ and $Q$ rail due to the two path channel, the scatter plot also shows the sample locations at equal distances from the ideal constellation points. This is the kind of the signal make-up that enables many equalizers to remove the channel effects.
Keep in mind that a simple example was chosen here to uncover the hidden structure within the channel that is clearly distinguished from other sources of signal impairment. As the channel gets more complicated with several paths, delays and phases, the eye closes and much randomness appears to spread over the signal. The eye diagrams and scatter plots for such channels are significantly more convoluted than the simple case depicted here. Nevertheless, the channel is still a discrete-time filter and can be mitigated through suitable equalization strategies such as a Least Mean Square (LMS) algorithm, Constant Modulus Algorithm (CMA) or Decision Feedback Equalization (DFE).