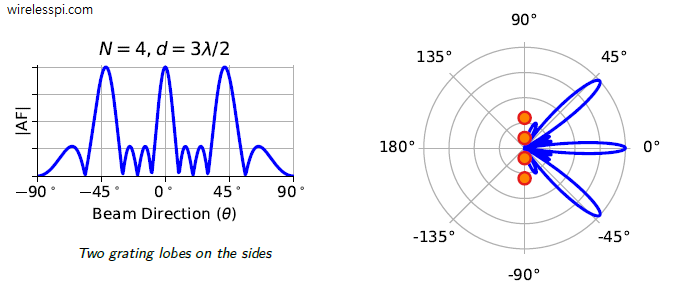
Two grating lobes on the sides

How Do Beams Look Like?

In the article on beamforming, we discussed the interaction of the electromagnetic waves with the antenna array without any description of what the beam shape looks like. As we explore below now, the beam shape is given by the Fourier Transform of individual antenna intensities but the reason behind this is not always explained in most of the textbooks and tutorials on this topic. Where exactly does the Fourier Transform, a conversion tool from time $t$ to frequency $\omega=2\pi F$ domain, come into the picture? And how does the frequency $\omega$ for time domain correspond to phase shift $u$ of

Continue reading
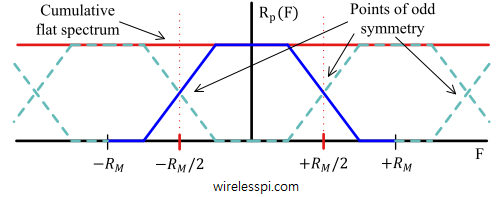
Odd symmetry around frequency points at half symbol rate adding up to a flat spectrum

Proof of Poisson Sum Formula

The Poisson sum formula was discovered by the French mathematician and physicist Siméon Denis Poisson. It has several applications in digital signal processing, among which our concern is the periodic summation of modulated pulses in digital communication systems. Assume that $p(t)$ is a pulse shape (or any continuous-time function if you are not familiar with digital communications) and $P(f)$ is its Fourier Transform. The pulse is sampled at a rate of $f_s$ to produce its discrete version $p(nT_s)$ where $T_s=1/f_s$ is the duration between two samples. The Poisson summation formula relates these two quantities as \begin{equation}\label{equation-poisson-sum-formula} \frac{1}{T_s}\sum _{k=-\infty}^{\infty} P\left(f+\frac{k}{T_s}\right) =

Continue reading
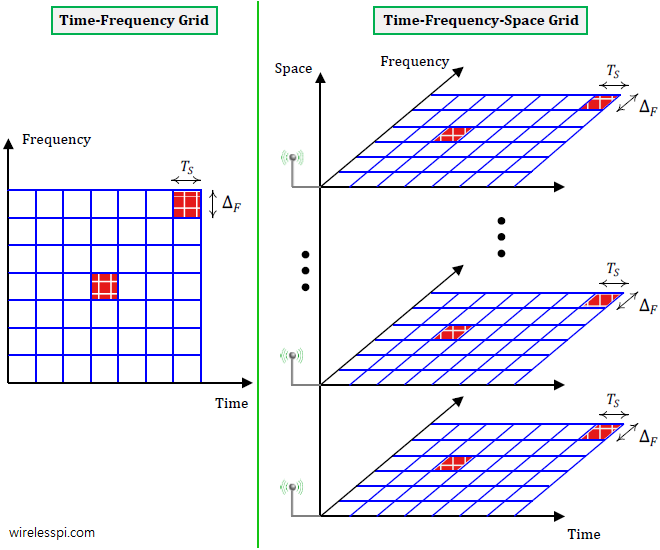
A view of time-frequency-space grid in a communication system

How Multiple Antennas Sample the Signal

Once upon a time, an antenna was viewed as a simple device to transmit and receive an electromagnetic wave, much like a battery the sole purpose of which is to provide electrical power. A set of antennas, however, can be viewed from a new angle as follows. Sampling in Time Domain An Analog-to-Digital Converter (ADC) is a device that samples an analog signal in time domain to create a corresponding sequence of numbers. Similarly, a Digital-to-Analog Converter (DAC) gets a sequence of numbers as an input to generate a reconstructed analog signal. As an example, a rectangular pulse shape is

Continue reading
An atom and the solar system

Sampling and the Mysterious Scaling Factor

This post treats the signals in continuous time which is different than the approach I adopted in my book. The book deals exclusively in discrete time. Some time ago, I came across an interesting problem. In the explanation of sampling process, a representation of impulse sampling shown in Figure below is illustrated in almost every textbook on DSP and communications. The question is: how is it possible that during sampling, the frequency axis gets scaled by $1/Ts$ — a very large number? For an ADC operating at 10 MHz for example, the amplitude of the desired spectrum and spectral replicas

Continue reading
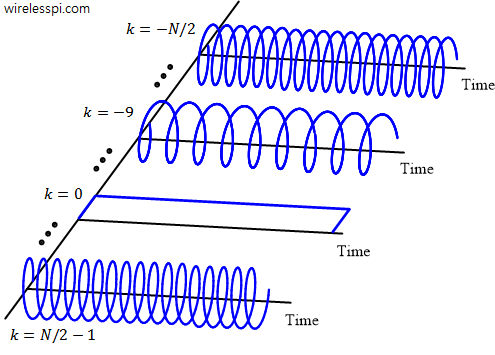
Complex sinusoids drawn to highlight the discrete frequency axis k on the left side

Discrete Frequency

An Analog to Digital Converter (ADC) samples a continuous-time signal to produce discrete-time samples. For a digital signal processor, this signal just resides in memory as a sequence of numbers. Consequently, the knowledge of the sample rate $F_S$ is the key to signal manipulation in digital domain. As far as time is concerned, one can easily determine the period or frequency of such a signal stored in the memory. For example, the period $T$ in the sinusoid of Figure below is clearly $10$ samples and sample time $T_S=1/F_S$ can be employed to find its period in seconds. For a sample

Continue reading