Error Vector Magnitude (EVM) for 1 symbol

What is Error Vector Magnitude (EVM)?

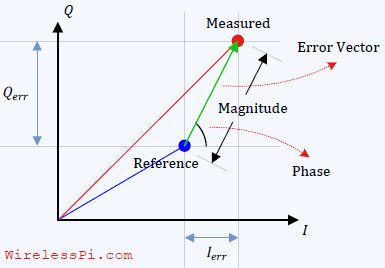
Measuring the performance of a digital communication system is not a straightforward task as different impairments have different impacts on the final bit error rate. Error Vector Magnitude (EVM) is a useful metric that helps gauge the impact of all impairments simultaneously from a single value. A Single Modulation Symbol We start with observing a single modulation point at the receive end. Once we establish the baseline error in this scenario, we will combine the effect of all such symbol points into a single number. Assume that a modulation symbol S is represented by a blue constellation point in the

Continue reading
Time domain formation of a Raised Cosine pulse for unity excess bandwidth

How Excess Bandwidth Governs Timing Recovery in Digital Communication Systems

In the article on pulse shaping, we described the excess bandwidth, also known as roll-off factor, as the extra fractional bandwidth required to shape the spectrum. As it turns out, this excess bandwidth is also crucial for accomplishing timing synchronization in single-carrier systems due to its participation in generating spectral timing lines. Spectral Timing Lines Since a data stream consists of a sequence of 1s and 0s, the signal waveform is not a pure clock. Instead, a series of 1s and 0s appear in random order. The purpose of timing synchronization is to extract a clock out of this waveform.

Continue reading
Eye diagram for a 4-QAM modulated signal and a simple channel impulse response

Impact of Multipath on the Received Signal

In this article, we describe the impact of multipath caused by the wireless channel on the signal arriving at the receiver from a constellation viewpoint. Recall that an eye diagram, a transition diagram and a scatter plot are the stethoscopes of a communication system and hence it is imperative to bring in that perspective for a Tx signal convolved with the channel impulse response. This is because a wireless channel can be seen as a Finite Impulse Response (FIR) filter with the result that the sampled Rx signal is a convolution between taps of this FIR filter and the Tx

Continue reading
All symbol intervals are overlayed on top of one another and the time axis is shifted to bring ideal sampling instant in the middle. Eye diagram generated for 250 2-PAM symbols and Square-Root Raised Cosine pulse with excess bandwidth 0.5

Tools for Signal Diagnosis

In this article, we will devise some tools that help us diagnose problems with the communication system under study. I like to call them the stethoscopes for a communication system due to the crucial functionality they provide regarding the health of the communication system being analyzed. We discuss three such tools, namely an eye diagram, a transition diagram and a scatter plot below. Eye Diagram An eye diagram is an excellent summary of the signal behaviour in time domain, something analogous to a spectrum in frequency domain. Imagine the samples of the matched filter output taken at a much higher

Continue reading