Block diagram of a pulse amplitude modulator and demodulator

Pulse Amplitude Modulation (PAM)

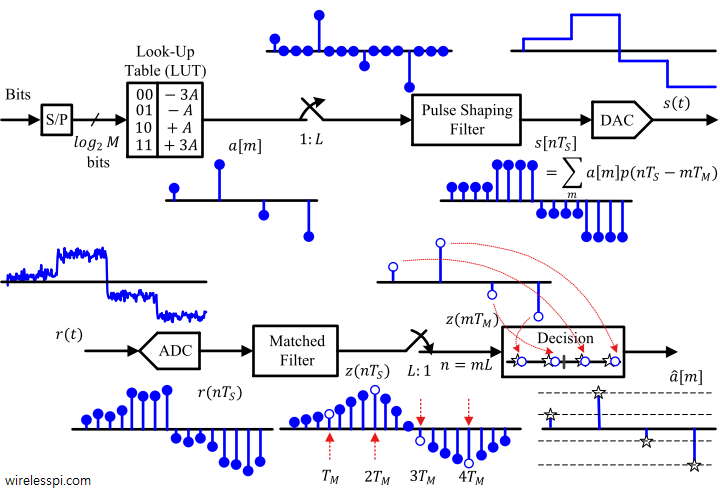
In the article on modulation – from numbers to signals, we said that the Pulse Amplitude Modulation (PAM) is an amplitude scaling of the pulse $p(nT_S)$ according to the symbol value. What happens when this process of scaling the pulse amplitude by symbols is repeated for every symbol during each interval $T_M$? Clearly, a series of bits $b$ (1010 in our initial example) can be transmitted by choosing a rectangular pulse and scaling it with appropriate symbols. \begin{equation*} \begin{aligned} m = 0 \quad b = 1 \quad a[0] = +A \\ m = 1 \quad b = 0 \quad a[1]

Continue reading
The blue line is the signal template and while red is the matched filter. Notice the same magnitude on each spectral line but exactly opposite phase

Demodulation – From Signals Back to Numbers

Remember that in the article on correlation, we discussed that correlation of a signal with proper normalization is maximum with itself and lesser for all other signals. Since the number of possible signals is limited in a digital communication system, we can use the correlation between incoming signal $r(nT_S)$ and possible choices $s_0(nT_S)$ and $s_1(nT_S)$ in a digital receiver. Consequently, a decision can be made in favor of the one with higher correlation. It turns out that the theory of maximum likelihood detection formalizes this conclusion that it is the optimum receiver in terms of minimizing the probability of error.

Continue reading
Illustration of peak ISI and asymmetry about -3dB point

Pulse Shaping Filter

In digital logic, a stream of 1s and 0s forms a sequence of rectangular pulses, which can be easily identified at the receiver side by a threshold. In time domain, everything looks nice and perfect. Let us investigate the system characteristics in frequency domain. In a Pulse Amplitude Modulation (PAM) system, the main component that defines the spectral contents of the signal is the pulse shape $p(nT_S)$ at the Tx. We start with our attention towards a simple rectangular pulse shape. Here is a brief outline of what we cover in this article. Table of Contents 1. Spectrum of a

Continue reading