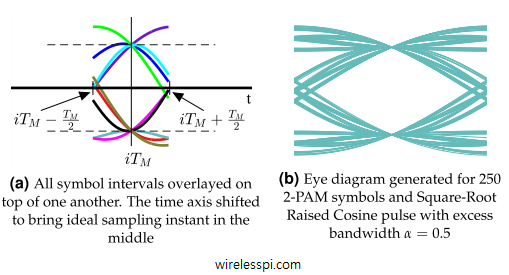
All symbol intervals are overlayed on top of one another and the time axis is shifted to bring ideal sampling instant in the middle. Eye diagram generated for 250 2-PAM symbols and Square-Root Raised Cosine pulse with excess bandwidth 0.5

Tools for Signal Diagnosis

In this article, we will devise some tools that help us diagnose problems with the communication system under study. I like to call them the stethoscopes for a communication system due to the crucial functionality they provide regarding the health of the communication system being analyzed. We discuss three such tools, namely an eye diagram, a transition diagram and a scatter plot below. Eye Diagram An eye diagram is an excellent summary of the signal behaviour in time domain, something analogous to a spectrum in frequency domain. Imagine the samples of the matched filter output taken at a much higher

Continue reading
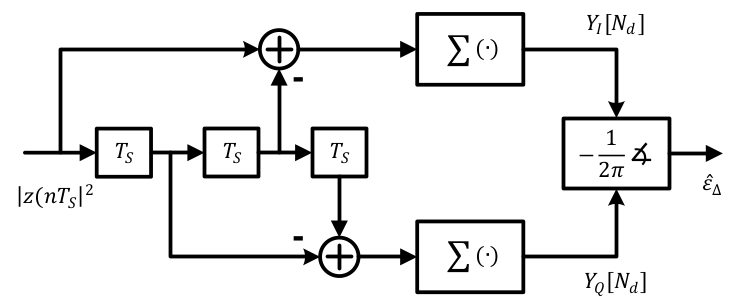
A block diagram for the implementation of a digital filter and square timing recovery for L=4 samples/symbol

Digital Filter and Square Timing Recovery

We have seen before how a symbol timing offset severely impacts the constellation of the received symbols. Therefore, symbol timing recovery is one of the most crucial jobs of a digital communications receiver. In the days of analog clock recovery, a timing error detector provided the instant to sample the Rx waveform at 1 sample/symbol at the maximum eye opening. However, discrete-time processing opened the doors for better timing recovery schemes as an ever increasing number of transistors within the same area consistently keeps bringing the digital processing cost down. Consequently, the use of analog circuits to control the timing

Continue reading
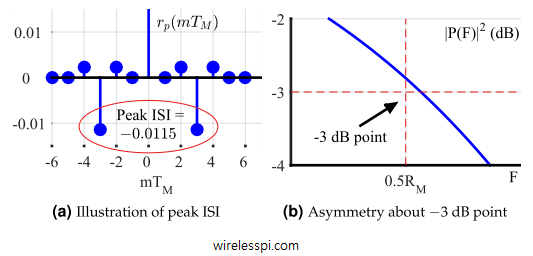
Illustration of peak ISI and asymmetry about -3dB point

Pulse Shaping Filter

In digital logic, a stream of 1s and 0s forms a sequence of rectangular pulses, which can be easily identified at the receiver side by a threshold. In time domain, everything looks nice and perfect. Let us investigate the system characteristics in frequency domain. In a Pulse Amplitude Modulation (PAM) system, the main component that defines the spectral contents of the signal is the pulse shape $p(nT_S)$ at the Tx. We start with our attention towards a simple rectangular pulse shape. Here is a brief outline of what we cover in this article. Table of Contents 1. Spectrum of a

Continue reading