Width of a sinc signal increases and approaches a constant, just like an eagle spreading its wings

A Unit Impulse in Continuous-Time

This post treats the signals in continuous time which is different than the approach I adopted in my book which deals exclusively in discrete time. A unit impulse is defined as \begin{equation*} \delta (t) = \displaystyle{\lim_{\Delta \to 0}} \begin{cases} \frac{1}{\Delta} & -\frac{\Delta}{2} < t < +\frac{\Delta}{2} \\ 0 & \text{elsewhere} \end{cases} \end{equation*} The result is an impulse with zero width and infinite height, but a consequence of defining it in this way is that the area under the curve is unity. \begin{equation*} \text{Area under a rectangle} = \Delta \cdot \frac{1}{\Delta} = 1 \end{equation*} This is shown in Figure below. Stated

Continue reading
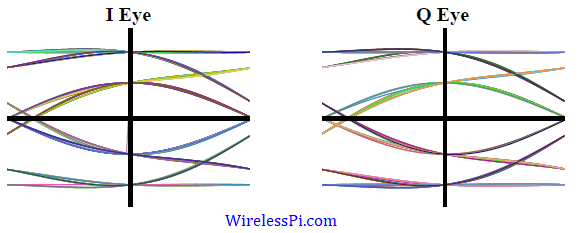
Eye diagrams for I arm of a 4-QAM signal for 15, 30 and 45 degrees phase offsets and a Raised Cosine filter with excess bandwidth 0.5. A similar eye diagram exists for Q arm as well

What is Carrier Phase Offset and How It Affects the Symbol Detection

In case of Quadrature Amplitude Modulation (QAM) and other passband modulation schemes, Rx has no information about carrier phase of the Tx oscillator. Let us explore what impact this has on the demodulation process. Constellation Rotation To see the effect of the carrier phase offset, consider that a transmitted passband signal consists of two PAM waveforms in $I$ and $Q$ arms denoted by $v_I(t)$ and $v_Q(t)$ respectively and combined as \begin{equation}\label{eqRealWorldQAMPhaseOffset} s(t) = v_I(t) \sqrt{2} \cos 2\pi F_C t – v_Q(t) \sqrt{2}\sin 2\pi F_C t \end{equation} Here, $F_C$ is the carrier frequency and $v_I(t)$ and $v_Q(t)$ are the continuous versions

Continue reading
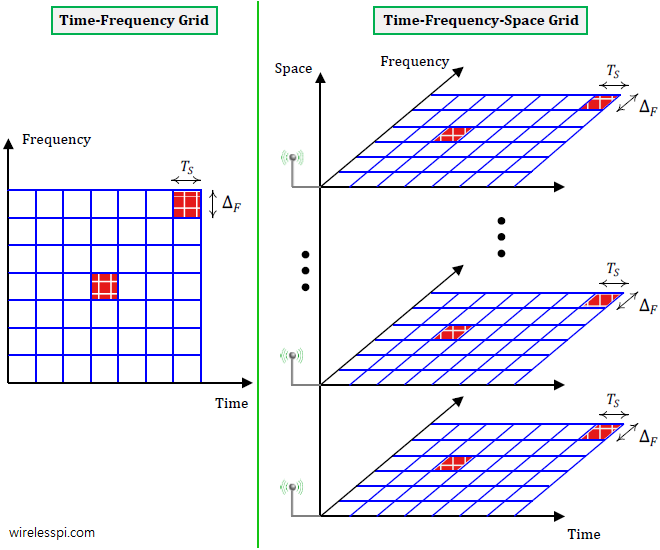
For the same area and their spacing (with respect to the wavelength), the number of elements in the array at high band is larger thus capturing a similar or increased amount of power

Free Space Propagation in mmWave Systems

In this article, we describe the free space propagation in mmWave systems. During the discussion, we dispel a common myth that the received power at any distance decays with increasing carrier frequency. We will see that the received power is in fact independent of the carrier frequency for suitably designed systems such as those at mmWave frequencies. Instead, it is only after including the atmospheric effects such as water vapors, oxygen, rain and penetration loss in materials that the carrier frequency plays a substantial role in establishing the link budget. Suppose that a Tx transmits $P_{\text{Tx}}$ watts of power uniformly

Continue reading
Phase jumps at every zero crossing from modulating data onto the carrier phase for a QPSK waveform

The Fundamental Problem of Synchronization

We have seen in the effect of phase rotation that the matched filter outputs do not map back perfectly onto the expected constellation, even in the absence of noise and no other distortion. Unless this rotation is small enough, it causes the symbol-spaced optimal samples to cross the decision boundary and fall in the wrong decision zone. And even for small rotations, relatively less amount of noise can cause decision errors in this case, i.e., noise margin is reduced. In fact, for higher-order modulation, the rotation becomes even worse because the signals are closely spaced with each other for the

Continue reading
A general QAM detector with respective waveforms at each block

Quadrature Amplitude Modulation (QAM)

Quadrature Amplitude Modulation (QAM) is a spectrally efficient modulation scheme used in most of the high-speed wireless networks today. We discussed earlier that Pulse Amplitude Modulation (PAM) transmits information through amplitude scaling of the pulse $p(nT_S)$ according to the symbol value. To understand QAM, two routes need to be traversed. Route 1 We start the first route with differentiating between baseband and passband signals. A baseband signal has a spectral magnitude that is nonzero only for frequencies around origin ($F=0$) and negligible elsewhere. An example spectral plot for a PAM waveform is shown below for 500 2-PAM symbols shaped by

Continue reading