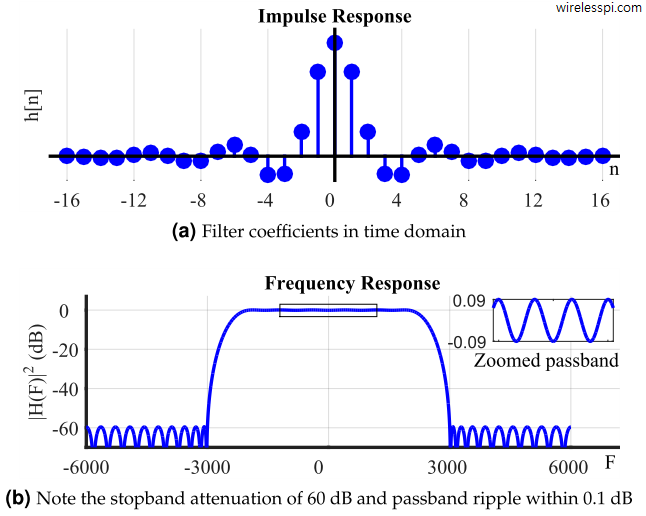
Time and frequency response of a lowpass FIR filter designed with Parks-McClellan algorithm for N=33

Finite Impulse Response (FIR) Filters

We learned in the concept of frequency that most signals of practical interest can be considered as a sum of complex sinusoids oscillating at different frequencies. The amplitudes and phases of these sinusoids shape the frequency contents of that signal and are drawn through magnitude response and phase response, respectively. In DSP, a regular goal is to modify these frequency contents of an input signal to obtain a desired representation at the output. This operation is called filtering and it is the most fundamental function in the whole field of DSP. It is possible to design a system, or filter,

Continue reading
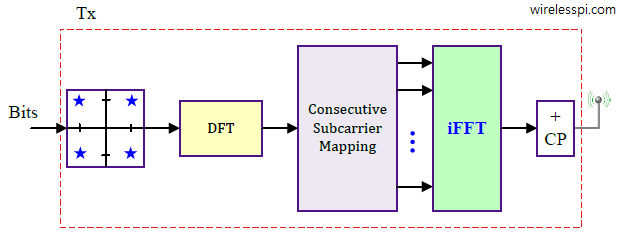
DFT-Precoded OFDM block diagram

DFT-Precoded OFDM

One of the drawbacks of an OFDM waveform is its high Peak to Average Power Ratio (PAPR). This high PAPR arises from the fact that a set of $N$ QAM symbols are taken into time domain through an inverse Fourier Transform (iFFT) operation that basically generates a combination of complex sinusoids scaled by those symbols. Due to the variations between the symbol values and the sinusoids with different frequencies, the output waveform can have a large variance in amplitudes. This reduces the power amplifier efficiency that results in faster battery drainage in a mobile terminal. The effect on base station

Continue reading
A DNA double helix

The Concept of Frequency

A wireless signal from one device to another travels through the use of electromagnetic waves propagated by an antenna. Electromagnetic waves have different frequencies and one can pick up a specific signal by tuning a radio Rx to a specific frequency. But what is a frequency anyway? Watch the video below for an interesting description of actual time domain samples and how to interpret their frequency domain representation. A Complex Sinusoid Consider a complex number $V$ in an $IQ$-plane. A complex number is defined as a pair of real numbers in $(x,y)$-plane similar to the vectors but with different arithmetic

Continue reading
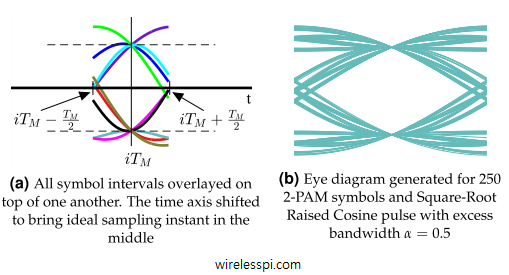
All symbol intervals are overlayed on top of one another and the time axis is shifted to bring ideal sampling instant in the middle. Eye diagram generated for 250 2-PAM symbols and Square-Root Raised Cosine pulse with excess bandwidth 0.5

Tools for Signal Diagnosis

In this article, we will devise some tools that help us diagnose problems with the communication system under study. I like to call them the stethoscopes for a communication system due to the crucial functionality they provide regarding the health of the communication system being analyzed. We discuss three such tools, namely an eye diagram, a transition diagram and a scatter plot below. Eye Diagram An eye diagram is an excellent summary of the signal behaviour in time domain, something analogous to a spectrum in frequency domain. Imagine the samples of the matched filter output taken at a much higher

Continue reading
Complex sinusoids drawn to highlight the discrete frequency axis k on the left side

Discrete Frequency

An Analog to Digital Converter (ADC) samples a continuous-time signal to produce discrete-time samples. For a digital signal processor, this signal just resides in memory as a sequence of numbers. Consequently, the knowledge of the sample rate $F_S$ is the key to signal manipulation in digital domain. As far as time is concerned, one can easily determine the period or frequency of such a signal stored in the memory. For example, the period $T$ in the sinusoid of Figure below is clearly $10$ samples and sample time $T_S=1/F_S$ can be employed to find its period in seconds. For a sample

Continue reading