A wireless signal from one device to another travels through the use of electromagnetic waves propagated by an antenna. Electromagnetic waves have different frequencies and one can pick up a specific signal by tuning a radio Rx to a specific frequency. But what is a frequency anyway? Watch the video below for an interesting description of actual time domain samples and how to interpret their frequency domain representation. A Complex Sinusoid Consider a complex number $V$ in an $IQ$-plane. A complex number is defined as a pair of real numbers in $(x,y)$-plane similar to the vectors but with different arithmetic
Continue reading
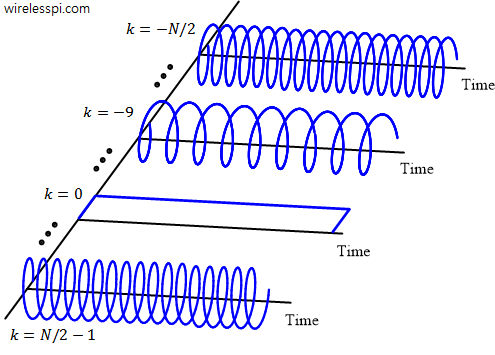
![Magnitude of frequency response |H[k]| in response to complex sinusoids at all N frequencies](https://wirelesspi.com/wp-content/uploads/2016/08/figure-introduction-freq-response.png)