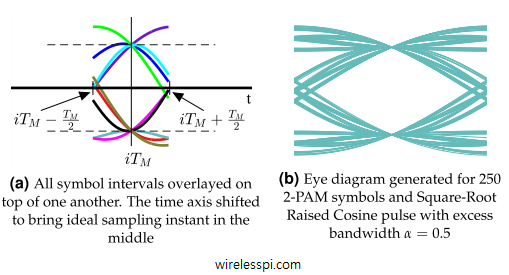
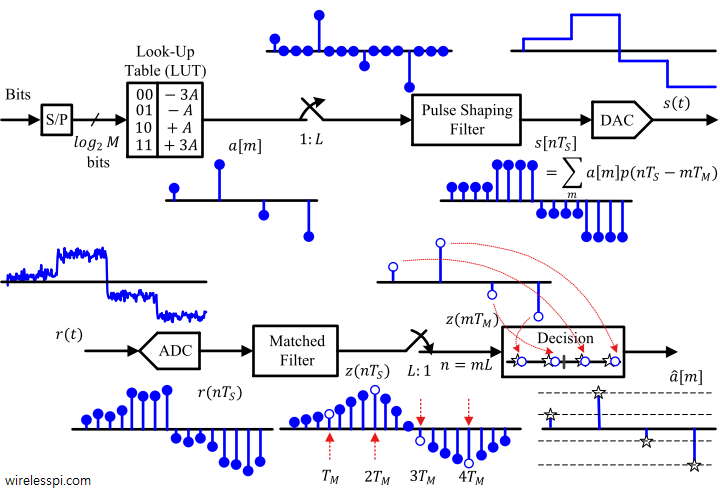
In this article, we will devise some tools that help us diagnose problems with the communication system under study. I like to call them the stethoscopes for a communication system due to the crucial functionality they provide regarding the health of the communication system being analyzed. We discuss three such tools, namely an eye diagram, a transition diagram and a scatter plot below. Eye Diagram An eye diagram is an excellent summary of the signal behaviour in time domain, something analogous to a spectrum in frequency domain. Imagine the samples of the matched filter output taken at a much higher
Continue reading