Aesop was a Greek storyteller who created lots of short stories more than 2500 years ago (such as the hare and the tortoise), now collectively known as Aesop’s Fables. "A man is known by the company he keeps" is a quote also attributed to him that has survived through the ages and has proven to be a timeless truth. The k-Nearest Neighbors (k-NN) algorithm is essentially based on the same idea. It suggests that when a machine needs to classify a new data point in an application, examining its neighboring data points is an effective strategy.
In the spirit of Aesop’s approach, I will explain the k-NN concept in a simple manner. The starting point is the significance of numbers; why does a machine play with numbers?
The answer is that in the world of digital electronics, many real-world phenomena are translated into sequences of binary numbers. Some examples are given below.
- A Software Defined Radio (SDR) converts an analog signal impinged on the receive antenna from the arriving electromagnetic wave into its digital representation. Then, DSP algorithms are employed to demodulate the bit sequence sent by the transmitter.
- Audio signals are digital representations of the variations in air pressure caused by our speech.
- Computer images are nothing but long sequences of binary numbers arising from sensor measurements of the color and brightness of each pixel.
This is not much different than the digital rain in The Matrix.

Since every application is actually dealing with binary representation of numbers, machine learning algorithms are simply mathematical techniques to manipulate those numbers towards a desired outcome.
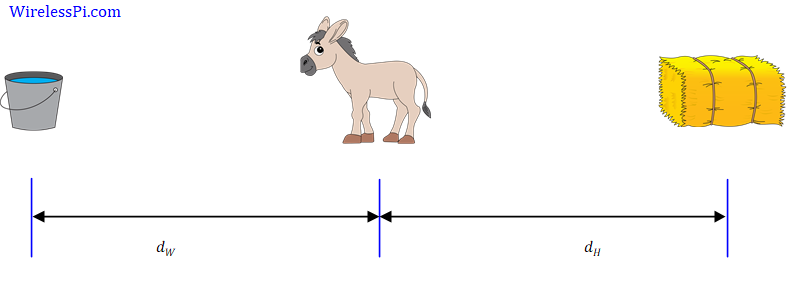
Let us start with the description of the Buridan’s donkey.
Buridan’s Donkey
Named after the French philosopher Jean Buridan, this philosophical paradox deals with the free will of an organism.

Assume a hypothetical situation where a donkey, who is equally hungry and thirsty, finds itself at an equal distance from a stack of hay and a pail of water.
\[
d_H = d_W
\]
A purely rational donkey would die of both hunger and thirst, unable to decide whether to pursue the hay or water first. The situation arises due to an assumption in this paradox that the donkey will always go to the closest item. We can conclude the following.
- Although the donkey, hay and water are real items, we are talking about numbers $d_H$ and $d_W$.
- More importantly, the distance from an object can play a crucial role in decision making!
On a similar note, an aggregate closest distances decide the list of nearest neighbors, as we see next.
1-Nearest Neighbor (1-NN)
Consider the figure below which shows the existing training data divided into three classes.
- Blue dots
- Purple trapezoids
- Red asterisks

Now a new data point shown by a black and white star emerges. The question is which class this new received point belongs to? From the naked eye, it should clearly be a red asterisk. But a machine has no eyes, so how does it reach the same conclusion?
One way a machine can accomplish this task is by computing the distance of the new point from all the training dataset and decide in favor of the same class as its nearest neighbor. Mathematically speaking, if the coordinates of the $N$ training points are $(x_k, y_k)$ while those of the target point are $(x_0, y_0)$, we can find their squared Euclidean distance as
\[
d_k = (x_k-x_0)^2 + (y_k-y_0)^2
\]
where the square root is omitted due to its irrelevance in distance comparison (as a result of which the machine needs less computations). The decision is in favor of the class for which a member has the smallest $d_k$. This is the 1-Nearest Neighbor algorithm in a nutshell.
k-Nearest Neighbor is simply a generalization of this concept.
k-Nearest Neighbors
Let us extend the same idea to $k=3$ now, as shown in the figure below.

The first step is to compute the distances of the new data point with all training samples. The example results are shown in the table below where the distance column has been sorted in an ascending order.
| Neighbor Rank | Training Point | Distance |
|---|---|---|
| 1 | Red asterisk | 1.9 |
| 2 | Purple trapezoid | 2.5 |
| 3 | Purple trapezoid | 2.6 |
| 4 | Blue dot | 2.9 |
| 5 | Purple trapezoid | 3.4 |
| $\vdots$ | $\vdots$ | $\vdots$ |
It is clear from the above table that the decision of the algorithm about the new data point depends on the value of $k$ where it takes a majority decision from the number of candidates.
- For $k=1$, it is associated with the red asterisk class.
- For $k=3$, it is associated with the purple trapezoid class.
- For $k=5$, it is associated with the purple trapezoid class.
An odd number of training points are chosen to avoid a tie between classes that can arise for an even number of points. Having a basic understanding of the algorithm, we can now turn towards the supplementary details.
The Algorithm
Given a new data point, the operation of the k-NN algorithm is given by the following steps:
- Compute the distances: The first step is to compute the distance between the new data point and all the training data points. The most commonly used distance metrics are Euclidean distance and Manhattan distance.
- Identify the nearest neighbors: The next step is to sort the neighbors according to their distances from the new data point and identify $k$ nearest neighbors.
- Favor a majority vote or calculate the average: For classification purpose, the algorithm takes a majority vote of the $k$ nearest neighbors’ classes and assigns the most common class to the new data point. In our example above, the algorithm assigns purple trapezoid class to the new data point for $k=3$ because 2 out of 3 nearest neighbors belong to that class.
On the other hand, for regression purpose, the algorithm takes an average of the values of $k$ nearest neighbors that is assigned to the new data point.
- Output: The output of the algorithm is the assigned class for classification problems and the average value for regression problems.
Observations
The following comments are now in order.
- The k-NN algorithm does not require any assumptions about the underlying distribution from which the data points originate. Instead, it stores all the training dataset that is employed for each new prediction. Therefore, it is known as a non-parametric and lazy algorithm: non-parametric because there are no model parameters and lazy as it delays the processing until the target data point arrives.
- The number of neighbors $k$ is a hyperparameter that is set by the user to control the learning process.
Applications of the k-NN Algorithm
Recall the discussion at the start where we said that digital signals are nothing but a long series of numbers. Keeping in view this number perspective, the k-NN algorithm can be applied to many scenarios, some of which are as follows.
Image Recognition: The k-NN algorithm is widely used in image recognition and computer vision. It can be used to classify images by comparing them to a database of known images. The algorithm works by calculating the distance between the new image and each image in the database, and then selecting the k-closest images based on that distance metric. Once the k-closest images are identified, the algorithm can then determine the class of the new image based on the majority class of the k neighbors.
Recommendation Systems: The k-NN algorithm is used in recommendation systems to recommend items to users based on their past behavior or preferences. For example, a movie recommendation system might recommend a new movie to a user based on the movies they have previously watched and rated highly. The k-NN algorithm can be used to find the k-closest users to a given user based on their past behavior. These users are called the “nearest neighbors,” and their past behaviors are used to predict the items that the given user might like.
Anomaly Detection: The k-NN algorithm is used for anomaly detection to identify rare or unusual events in a dataset that deviate from the expected behavior. For example, in credit card fraud detection, the k-NN algorithm can be used to identify transactions that are significantly different from the user’s past behavior. If a transaction is significantly different from the user’s past transactions, it may be flagged as a potential fraud.
Bioinformatics: The k-NN algorithm is used in bioinformatics to classify biological data such as DNA sequences, proteins, and gene expression levels. For example, the algorithm can be used to classify a new DNA sequence based on the k-closest known DNA sequences in a database.
Text Classification: The k-NN algorithm is used in text classification to classify documents into different categories. The algorithm works by comparing the new document to a database of known documents and identifying the k-nearest documents based on a similarity metric such as cosine similarity or Jaccard similarity.
Market Basket Analysis: The k-NN algorithm is used in market basket analysis to identify products that are frequently purchased together. The algorithm works by identifying the k-closest baskets that contain the new product and then recommending other products that are frequently purchased with those products.
Spam Filtering: The KNN algorithm is used in spam filtering to classify emails as either spam or legitimate. The algorithm works by comparing the new email to a database of known spam and legitimate emails and identifying the k-nearest emails based on a similarity metric. Once the k-nearest emails are identified, the algorithm can then determine the class of the new email based on the majority class of the k neighbors.
Conclusion
The k-Nearest Neighbors (k-NN) algorithm is a simple yet powerful machine learning technique used for classification and regression analysis. The algorithm is non-parametric and does not require any assumptions about the underlying data distribution. Instead, the algorithm stores all the training data and uses it to make predictions about new data points.
The k-NN algorithm has numerous applications in various fields such as image recognition, recommendation systems, anomaly detection, bioinformatics, text classification, market basket analysis, and spam filtering. With its simplicity and versatility, the k-NN algorithm is a valuable tool in the machine learning toolkit. Finally, you might also enjoy the article on the role of artificial intelligence in our future.