We have discussed before what a Discrete Fourier Transform (DFT) is and how to find the DFT of some commonly used signals. Here, we will see how a DFT acts as a (crude) bank of filters that can pass the signal contents around a desired frequency while blocking the rest.
Let us start with the definition of the DFT.
\begin{equation*}
\begin{aligned}
S_I[k]\: &= \sum \limits _{n=0} ^{N-1}\left[ s_I[n] \cos 2\pi\frac{k}{N}n + s_Q[n] \sin 2\pi\frac{k}{N}n\right] \\
S_Q[k] &= \sum \limits _{n=0} ^{N-1}\left[ s_Q[n] \cos 2\pi\frac{ k}{N}n – s_I[n] \sin 2\pi\frac{k}{N}n\right]
\end{aligned}
\end{equation*}
for each $k$. In complex notation, this DFT is defined as
\begin{equation*}
S[k] = \sum \limits _{n=0} ^{N-1} s[n]\exp\left(-j2\pi\frac{k}{N}n\right)
\end{equation*}
In the above equation,
- $k$ is the index of DFT output in frequency domain, $k = -N/2$, $\cdots,-1,0,1$, $\cdots,N/2-1$
- $S[k]$ is $k^{th}$ DFT output component
- $S_I[k]$ and $S_Q[k]$ are $I$ and $Q$ components of the DFT $S[k]$
- $n$ is the time domain index of input samples, $n=0,1,\cdots,N-1$
- $s[n]$ is the sequence of input samples
- $N$ is the number of data samples in discrete time domain and number of bins in discrete frequency domain
Frequency Bin $k=0$
Observe that for $k=0$, the DFT turns out to be
\begin{equation*}
S[k] = \sum \limits _{n=0} ^{N-1} s[n]
\end{equation*}
In words, this implies that the DFT output at baseband (discrete frequency $k=0$) is nothing but a sum of the input signal samples. If we divide this sum by $N$, we get the DC value of the signal. This can also be interpreted as the output of a filter whose impulse response consists of all ones from $0$ to $N-1$ (or $-N/2$ to $N/2-1$) as follows.
\begin{equation*}
S[k] = \sum \limits _{n=0} ^{N-1} 1\cdot s[n] = \sum \limits _{n=0} ^{N-1} h[n]\cdot s[n]
\end{equation*}
where the filter $h[n]$ has an impulse response
\begin{equation*}
h[n] =
\begin{cases}
1, & 0 \le n \le N-1 \\
0, & \text{otherwise}
\end{cases}
\end{equation*}
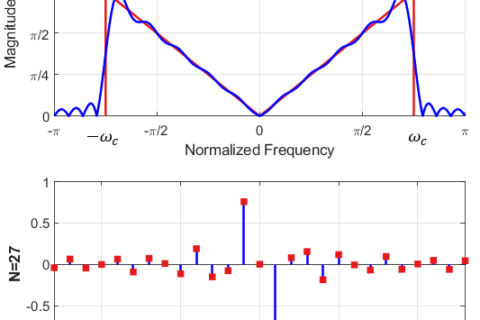
Ignoring a scaling factor $N$, this is known as a moving average filter. As a consequence of its flat impulse response, the frequency response of a moving average filter is the same as the frequency response of a rectangular pulse, i.e., a sinc signal. Both the impulse response and the spectrum are shown in the figure below. Note that to maintain a zero phase response in frequency domain, I have kept the span of the time domain signal from $n=-N/2$ to $n=N/2-1$ that keeps the signal symmetric around $n=0$. This is known as DFT symmetry.

The frequency response $S[k]$ is a sinc signal and does not look like a lowpass filter. However, let us plot the magnitude spectrum $|S[k]|^2$ on a dB scale as shown below.

Here, we can see why the spectrum can be interpreted as a crude lowpass filter since the output comes mainly from the energy under or close to the main lobe. As the DFT size $N$ increases, this main lobe becomes narrower and hence exhibits a reduced bandwidth. Keep in mind that the high side lobes produce a low stopband attenuation while the sinc shape in the middle instead of a flat passband response inflicts some distortion on the input signal.
Frequency Bins $k \neq 0$
Coming back to the DFT definition for $k \neq 0$, observe that the DFT is implementing the following two steps for each $k$.
[Downconversion] Multiply the input signal $s[n]$ with $e^{-j2\pi(k/N)n}$ — a complex sinusoid whose frequency is $-k$ complete cycles in an interval of $N$ samples (or $-k/N$ cycles per sample where a negative frequency implies clockwise rotation). This is exactly what is done during a downconversion process where a signal residing at frequency bin $+k/N$ cycles/sample is shifted to zero (or baseband) through mixing it with a complex sinusoid of frequency $-k/N$ cycles/sample.
[Filtering] The summation process in the definitions above is again a moving average filter within a scaling factor that is practically applied to a portion of the signal residing at frequency $+k/N$ cycles/sample.
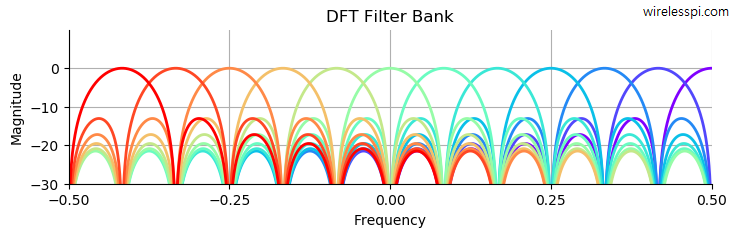
Therefore, the output of DFT can be interpreted as a bank of $k/N$-spaced bandpass filters where each filter has the frequency response of a sinc signal centered at frequency bin $k/N$. This is drawn in the figure below. Here, $k$ goes from $-N/2$ to $N/2-1$ and consequently the discrete frequency $k/N$ ranges from $-0.5$ to $0.5$.

How is This Related to OFDM?
Recall from the article on OFDM that the time domain signal in OFDM is generated through the inverse DFT of the modulation symbols. Therefore, instead of downconverting each signal component from frequency bin $k/N$, the iDFT operation upconverts the modulation symbols to their respective $N$ frequency bins forming a similar filterbank. This is plotted in the figure below without explicit modulation symbols.